
Ever feel like your train is late and overcrowded? If you're from the Eastern suburbs, there's a high chance you are right. And, perhaps more alarmingly, if your train line runs through some of Melbourne's poorer suburbs, you are more than nine times more likely to be on an overcrowded train than someone commuting through wealthier neighbourhoods.
These facts are concerning, but what is more concerning is that the Government failed to mention these facts in its recent review of Melbourne's metro trains. In its semiannual report, Metropolitan Train Peak Passenger Loads, Public Transit Victoria (PTV) has excluded almost 350 trains carrying a quarter of a million passengers. The omissions mask the number of overcrowded, delayed trains in the Eastern suburbs as well as the overcrowding experienced by travellers in Melbourne’s poorer suburbs.
The PTV report reviewed both the
number of overcrowded trains and the percentage of passengers riding on overcrowded
trains. The report stated only 11 per cent of all peak services were overcrowded. It also stated the percentage of people travelling on overcrowded
trains during peak periods had dropped from 23 per cent to 17 per cent.
But
the report did not count every train. The report, which focused on peak hour
traffic, stated that “cancellations and disruptions are excluded from the
analysis to ensure the survey results provide an accurate picture of how the
metropolitan rail network performs.” Complete
information was collected—PTV surveyors counted every train’s capacity for four
days—but not used.
In
mid-October, Victorian Greens leader Greg Barber accused the Napthine government
of fudging train numbers to hide overcrowding. Mr Barber obtained the raw data
via a Freedom of Information (FOI) request. His staff analysed trains from
8am-9am by entering hard
copy data into a spreadsheet.
Their
analysis showed that 113 trains were excluded from the 437 trains running
between 8am and 9am. Media outlets such as The
Age, followed by The Australian (which caught the attention of Crikey)
reported on the Greens’ discovery.
These
media reports, however, relied on the Greens’ analysis of one hour of data. The Guardian obtained the 53-page hard
copy and converted the complete dataset into a spreadsheet. In actual fact, of the 2208 peak-hour trains, 34 were
cancelled and 346 were excluded.
The raw
data showed PTV used inconsistent criteria for excluding trains. For example, PTV:
- included a 3:31pm Upfield train carrying 313 passengers that was seven minutes late
- excluded a 6:12pm Werribee train carrying 1024 passengers that was three minutes late.
Delays
and cancellations were the main reasons for discounting more than 225,000
passengers. “As it turns
out, there’s actually a hell of a lot of cancellations,” said Mr Barber,
“They’ve got more of a problem with overcrowding than the figures would
suggest.”
PTV
claimed the exclusions did not alter overall averages because they excluded
services immediately after late trains. Often, these services had fewer
passengers.
The transit authority was correct; the averages loads were similar (PTV averaged 564, the complete
dataset averaged 570). Similarly, PTV reported 64 services carrying more than
798 passengers; the actual count was 72.
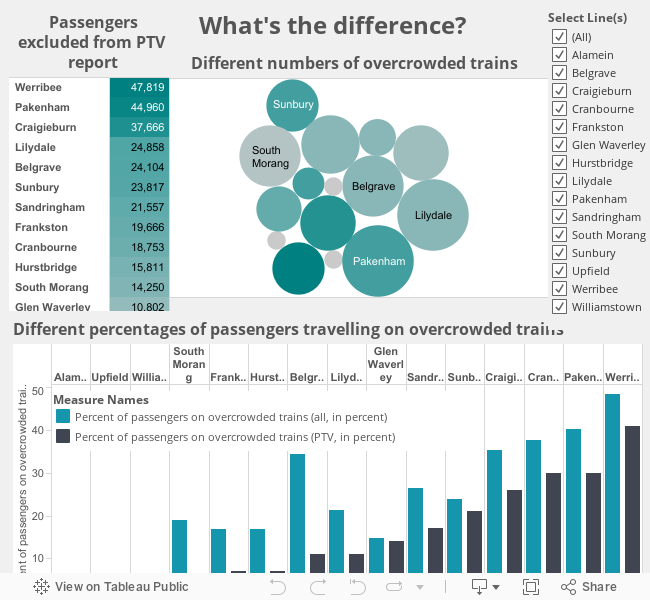
The averages
were comparable, but excluding the late trains concealed several facts. For example, PTV omitted 26 of the 32 overcrowded trains along the Ringwood corridor. And more than 65,000 people from the Eastern suburbs. When all trains are included, Lilydale had the highest number of late trains (85), and Belgrave the
second highest (50).
Train
usage along the Eastern corridor is a contentious area for the Napthine
government. On October 10, the Victorian parliament narrowly defeated a measure
to fund the development of the Doncaster Rail. Meanwhile, protests are increasing around
the test drilling of the East-West Link toll road.
In
addition to underplaying problems in the Eastern suburbs, PTV reported that system-wide,
only 17 per cent of passengers were on overcrowded services. But counting every
train over the four days showed 26 per cent of passengers were riding
overcrowded trains. On some lines, like Werribee, it was nearly one out of two
(48%).
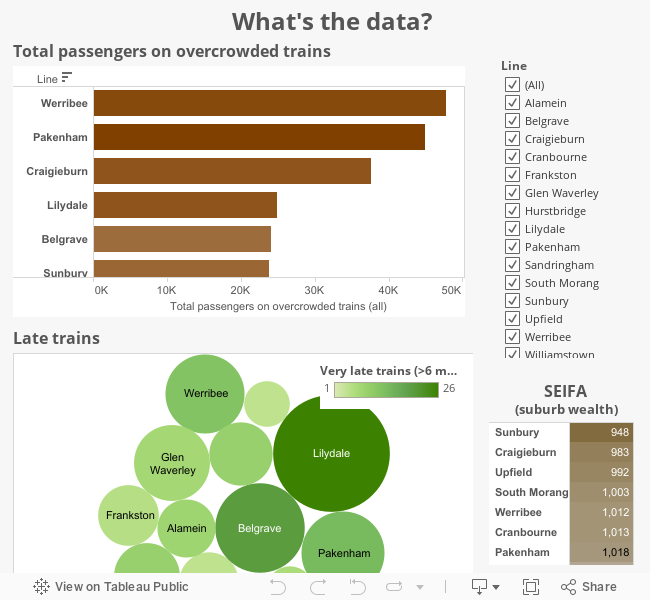
PTV intends
to use results to determine when and where extra services are needed. The
report made no mention of where the highest proportion of passengers were
riding on overcrowded trains: Werribee, Pakenham, Craigieburn and Sunbury.
These
lines service many of Melbourne’s poorer suburbs. To measure a rail line’s
wealth, one can averaged the ABS
postcode-level estimate of wealth (known as SEIFA) of every station along each
line. The Sandringham (1088) and Alamein (1086) lines scored well above the
Australian mean of 1000, while Craigieburn (983) and Sunbury (948) were below.
Based
on the SEIFA averages, it can be confirmed that there were more than twice as many overcrowded trains running
through Melbourne’s less-wealthy postcodes. The areas along these services were also less likely to be represented by Coalition MPs. This type of economic
discrimination in transport has been the subject of a successful California
court case where poor
urban riders took Oakland’s Metropolitan Transport Commission to court.
According to the Public Transit Users
Association, public transport provides social equity by making opportunities to
jobs, education and recreation reachable to everyone. But how responsible is Government for ensuring equal access to reliable transport?
“This Victorian Coalition Government is intent
on putting roads ahead of rail,” said Public Transit Users Association
president Tony Morton, “People are still packed into trains like sardines.”
Mr Morton suggested solutions such as improving signaling
along congested lines. The Napthine government has set aside $4.5
million in next year’s budget to develop the pilot High Capacity Signalling
project. However, the project will be implemented on the Sandringham line,
Melbourne’s wealthiest.
The
next survey will be in October 2013. Again, the complete
dataset will be available through FOI
requests. In the meanwhile, links to the May 2013 data are below, as well as
the syntax used to calculate the numbers used in this article. Find anything else? Send in your thoughts.
Notes on method:
- Want to find out if your train commute was excluded by PTV? Raw data available here (duplicates cleaned).
- SPSS 20 was used for calculations. Syntax available here.
- In case you are not an SPSS junkie, the compiled figures (by service) are available on this Google Doc.
- “Late train” was defined as being after three minutes—this appeared to be the exclusion rule for many trains, although it was not consistent and “late” was not defined in the report. Three minutes differ from Metro standards, which define a late train as more than five minutes late. In both scenarios, Lilydale and Belgrave had the highest numbers of late trains.
No comments:
Post a Comment